
|
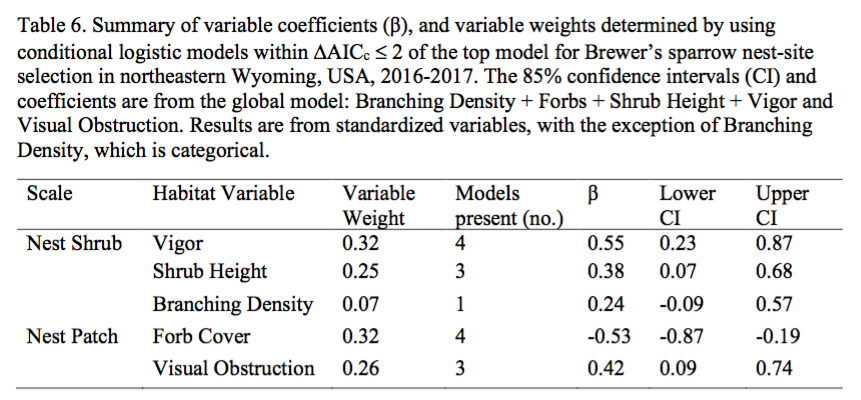
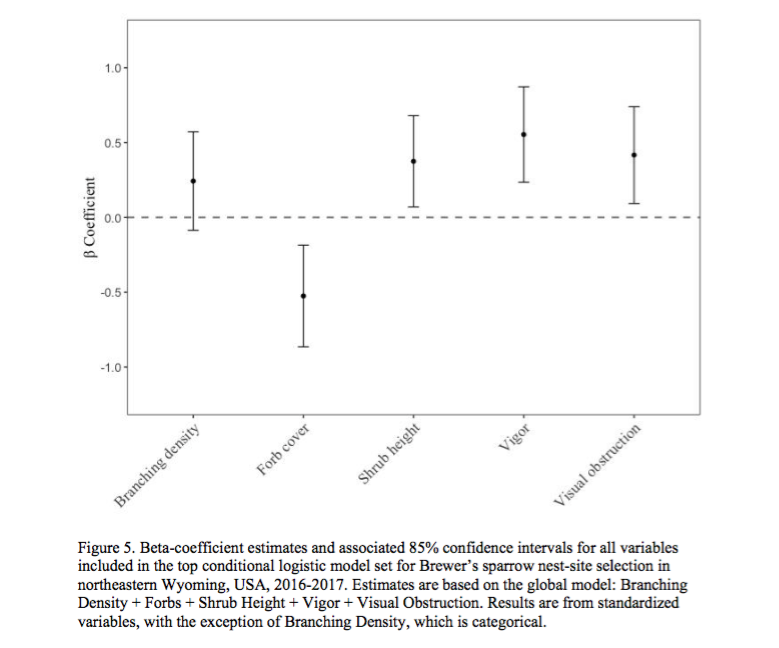
by Natasha Barlow In my last post, I briefly discussed a high-level summary of how I approach analyzing ecological field data. In this post, I will be discussing the method I use to write manuscripts. I should start by saying that when I refer to a ‘manuscript’, I am talking about the written document that you submit to a Journal (e.g., Journal of Wildlife Management) for consideration for publication. My experience is in avian (bird) ecology, conservation, and applied management, which is what I will be discussing in this article. Manuscript You have finished your analysis and it has pumped out some numbers (do not worry, it took me a long time to understand what my numbers meant and many, many, hours of making sure they were ‘correct’). Now what? The format I use to write is: Methods > Figures/Tables > Results > Introduction > Discussion > Abstract 1. Methods. I find this the easiest section to write and complete first. Since you just finished your analysis, it can be useful to write your methods immediately afterwards as the steps you took to get to the results are fresh in your mind. It is also useful to comment your script/code in R/RStudio throughout because you will undoubtedly go back to it in the future and you might have forgotten why you made some decisions that you made. I format my methods in this general way: field methods > justifying collection of variables > modeling approach used (#2 in the previous blog post) > transformations (#5 in the previous blog post; e.g., standardization) > variable selection (#6 and #7 in the previous blog post) > model selection (#8 in the previous blog post). 2. Figures and Tables. Determine how you want your readers to see your data and think hard about the best ways to show them your data in an easy to digest format. For example, would you rather look at the table, or the figure (or neither…) below? We decided to only include the figure in this article upon reviewer request because they essentially show the same thing, but the figure is nicer to look at. However, tables can also be useful. Without explaining the table and figure too much, anything above the horizontal dotted line in the figure you can think of as a bird preferring that variable in areas where it nests, and anything under the line is avoidance (don’t quote me; that’s not a great explanation). Clear as mud? The table is a bit more confusing though, and doesn’t add much to the story - so we removed it.
3. Results. You generally want the flow of your results to be chronological with the flow of your methods. This can be tricky, but I will use this article again as an example. In my methods section, I first mentioned the sampling for nest site selection of one bird species, and then the sampling to compare the preferences in nest site selection of two species. My results would follow a similar order, first showing the results of the one species nest site selection, and then the comparison between species. 4. Introduction. I am not a fan of writing introductions, but I find it useful to use the ‘snowball’ technique. That is, when you are searching through the literature, you will find that individuals reference others. It can be incredibly useful to look at the articles that are referenced, go to those articles, read them, and look at the other ones that are referenced, and continue. This is primarily how I completed many of my literature reviews. There are so many different formats you can use for introductions so I will not include a suggestion here. However, things that I find useful are when an article sets up the scope of the research within relevant and broad topics, discusses the limitations of the current knowledge, the gaps in the research that need to be filled, why your response variable matters, why your study site matters, and what specifically was your objective. 5. Discussion. Typically, the format follows the order of your results. Is what you found similar or different to what has been discussed in literature? Why do you suspect your results turned out this way? It is our job to untangle the ‘complex story’ of our work into something understandable. If nothing has been done on this topic in the past, use other research to fuel your hypotheses. It is also fine to discuss the limitations in your own research and the need for future work. In my work, we also bring the discussion back to wildlife management — or the bigger picture -- without trying to go beyond the scope of our data/region. Essentially, why does your research matter? 6. Abstract. Try to make your first sentence a clear, pointed start to the manuscript that addresses the topic. You also want, within the first sentence or two, to discuss the problem statement, or gap in the research that you are filling. I then follow up with a bit more introduction and specifically what I did and how I found my answer (what method I used). I then have a brief discussion of the main results I want to convey, and the resulting management implications. ** After all of the blood, sweat, and tears (“Nae pi ttam nunmul”…), you may submit your manuscript and it might get rejected. It sucks, but it happens all the time. My advisor reminded me that reviewers attack ideas, and your ideas are not your entirety as a person. Ideas can be changed. You can take what the reviewers say, correct any flaws, re-submit, or even try submitting to another journal. Your work is important, and the effort you do is not in vain!
8 Comments
by Natasha Barlow Starting my Masters at the University of Waterloo was terrifying. Imposter syndrome hits hard, you’re surrounded by people who will question your beliefs (rightly so; intellectual debates are useful), and you’re a fledgling when it comes to understanding the vast world that is ~statistics~. I remember frantically searching online for a ‘how-to’ guide on how to even wrap my brain around starting an analysis on my data. Luckily, I was in Dr. Brad Fedy’s lab, and was blessed to be surrounded by incredibly intelligent people who were willing to help little old me. In part one of this blog series, I am going to give a brief, high-level summary on how I was taught to start analyzing my data. The next post will be dedicated to the format I use for writing manuscripts. This is not to say there aren’t other ways to accomplish the same thing, but this format worked for me, and it’s my hope that it will be useful to you, too. For the purposes of this post I will be using my paper as an example. I will write this blog in a way that doesn’t require you to have access to the article for understanding. However, I am writing this blog post under the assumption that the reader has a basic knowledge of statistics. So…you’ve gone out for a few field seasons (or just one!) and have collected a dataset for your project. Now what? I am a strong believer that the data scientists collect should be published and peer-reviewed to maintain credibility and honesty, and that the knowledge we gain should be shared. Once you decide that you want to analyze your data, and potentially publish your research in a peer-reviewed journal, what is your first step? 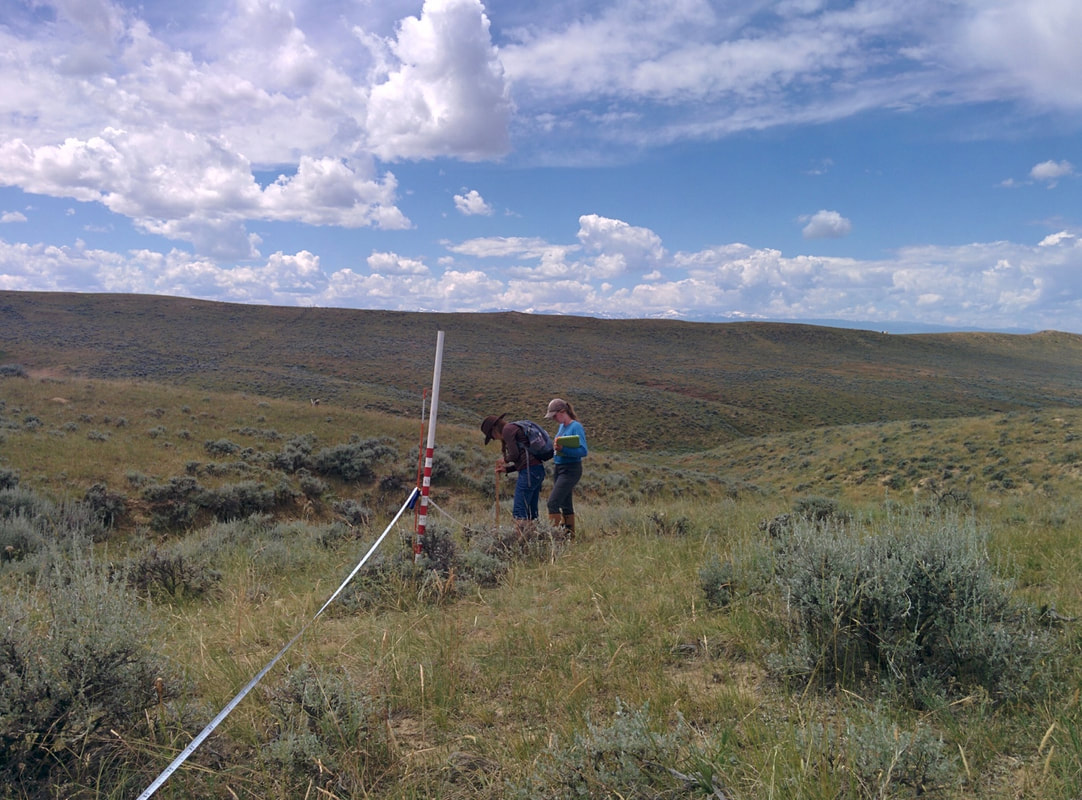 Field technicians collecting habitat vegetation variables along a transect in northeastern Wyoming, USA in 2017. Photo: Natasha Barlow. Your Seven Steps for Success 1. Determine your question. As mentioned in my previous ELB blog post, my advisor, Dr. Fedy, was a strong advocate of the approach, “you can only answer a question as well as you ask it”. It is ideal if you have a good sense of what specific questions you want to answer prior to gathering your data, although these can change with what data you were actually able to collect. 2. Research which analysis is the most appropriate for your question, your study design, your data collection methods, and your data. I really like using Google Scholar, but dedicated websites (e.g., Web of Science) work, too. By looking in the literature, you will likely come across studies that have collected similar data and have answered similar questions. Determine which analysis they performed and look into what is involved. Just because someone published a paper using one specific analysis does not mean it is the most appropriate way to analyze your data. New and improved analyses are being developed all the time, and it is best if you attempt to understand the analyses so your answer is closer to the truth. I eventually came across this McFarlanad, et al., 2017 paper which collected similar data to what I had for my manuscript, and the analysis they used looked like it might work for my study design. I went with it! BONUS TIP: If you email the authors directly or look on github, they may be able to provide you with their code. 3. Organize your data. Our lab uses the software R, and the program RStudio, because they’re free, you have arguably better control over your analysis, and it is used throughout many disciplines. We do not generally manipulate the raw data files themselves, and any transformation of the raw data into a useable format is done within R itself. The organization of your data will likely be dependent on what the analysis requires, and what R package(s) you will be using. You can see some short documents like this one (or longer vignettes) which can assist you in determining what format your data will need to be in. Know that this also takes some trial and error. Save your data organization script as a separate R file and save the transformed data output as a .csv (note: .csv files only save ONE active sheet, so if you change an Excel document to a .csv, it will only save one tab. For R, you will want all your data on one page anyways). 4. View your data. Open a new, separate R file and use it for your analysis. Import your .csv file from step 3, and you’re ready to go. It is generally a good idea to do another quality check on your data, using histograms, boxplots, and any visual tests to ensure that nothing was lost in transition, and there are not any mistakes in your data. This is where you can also test assumptions like normality, using qqplots, and others. 5. Prepare your data. Next, you can prepare your data for analysis. For example, in some cases I standardized my continuous variable data so different variables collected on different scales can be compared (e.g., the percentage of shrubs collected in %, height of grass collected in cm). Perhaps you will need to do log transformations on your data, or other preparations prior to analysis. 6. Check for correlations. It is generally a good idea, if you have a statistical model with multiple variables, that no variables should be correlated within the same model. This can make things very messy, for a variety of reasons that I will not explain here (and would not explain well). 7. Determine which variables to use. This step is generally required if you have a suite of predictor variables and you suspect that some may not actually influence your response variable. In my manuscript, we used univariate model selection and 85% confidence intervals, as well as thinking about biological relevance to the study species. That said, there are a variety of ways to determine which variables to use (e.g., AIC model selection). We started with over 20 habitat variables and narrowed it down to primarily being interested in 7 that seemed to inform our response variable. 8. Run your model. I used conditional logistic regression in my manuscript to determine the probability of nest-site selection of Brewer’s Sparrow based on a suite of variables I collected (the 7 from step #7 above). By viewing the documents on the R packages, you will be better equipped to set up the model formula correctly. Just remember, there are many models that are essentially just extensions of y = mx + b. 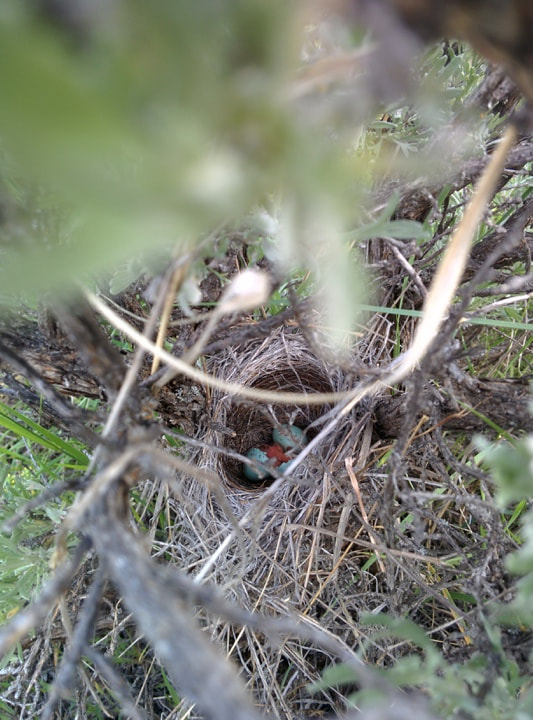 Hatch day for Brewer’s Sparrow nestlings in northeastern Wyoming, USA, in 2017. Photo: Natasha Barlow. *** Next, you work on ensuring that you understand the results from your analysis. You can always get answers out of data, but they may not be the right answer. It is our job as scientists to work hard to minimize the risk that we are interpreting something incorrectly. There are also great resources like the free R for Data Science website, or books that can help you navigate this difficult realm of academia! I recognize that this may seem like a huge hurdle to overcome, but I am absolutely not a guru and feel like I should have much more in depth understanding of this process and the analysis than what I currently have. Therefore, you can definitely accomplish this. It can be a challenge, but you can definitely persevere. In the next post, I will briefly discuss my tips for writing manuscripts, so stay tuned!
|
ELB MembersBlogs are written by ELB members who want to share their stories about Ontario's biodiversity. Archives
January 2023
Categories
All
|
 RSS Feed