
|
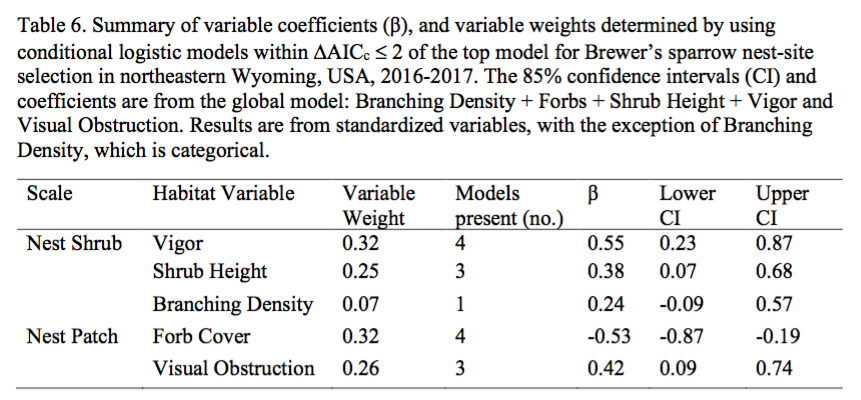
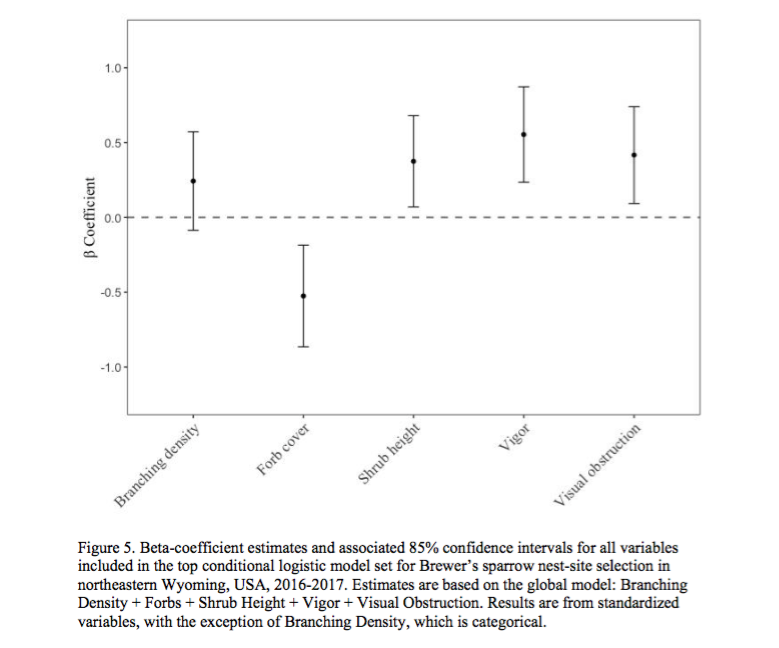
by Natasha Barlow In my last post, I briefly discussed a high-level summary of how I approach analyzing ecological field data. In this post, I will be discussing the method I use to write manuscripts. I should start by saying that when I refer to a ‘manuscript’, I am talking about the written document that you submit to a Journal (e.g., Journal of Wildlife Management) for consideration for publication. My experience is in avian (bird) ecology, conservation, and applied management, which is what I will be discussing in this article. Manuscript You have finished your analysis and it has pumped out some numbers (do not worry, it took me a long time to understand what my numbers meant and many, many, hours of making sure they were ‘correct’). Now what? The format I use to write is: Methods > Figures/Tables > Results > Introduction > Discussion > Abstract 1. Methods. I find this the easiest section to write and complete first. Since you just finished your analysis, it can be useful to write your methods immediately afterwards as the steps you took to get to the results are fresh in your mind. It is also useful to comment your script/code in R/RStudio throughout because you will undoubtedly go back to it in the future and you might have forgotten why you made some decisions that you made. I format my methods in this general way: field methods > justifying collection of variables > modeling approach used (#2 in the previous blog post) > transformations (#5 in the previous blog post; e.g., standardization) > variable selection (#6 and #7 in the previous blog post) > model selection (#8 in the previous blog post). 2. Figures and Tables. Determine how you want your readers to see your data and think hard about the best ways to show them your data in an easy to digest format. For example, would you rather look at the table, or the figure (or neither…) below? We decided to only include the figure in this article upon reviewer request because they essentially show the same thing, but the figure is nicer to look at. However, tables can also be useful. Without explaining the table and figure too much, anything above the horizontal dotted line in the figure you can think of as a bird preferring that variable in areas where it nests, and anything under the line is avoidance (don’t quote me; that’s not a great explanation). Clear as mud? The table is a bit more confusing though, and doesn’t add much to the story - so we removed it.
3. Results. You generally want the flow of your results to be chronological with the flow of your methods. This can be tricky, but I will use this article again as an example. In my methods section, I first mentioned the sampling for nest site selection of one bird species, and then the sampling to compare the preferences in nest site selection of two species. My results would follow a similar order, first showing the results of the one species nest site selection, and then the comparison between species. 4. Introduction. I am not a fan of writing introductions, but I find it useful to use the ‘snowball’ technique. That is, when you are searching through the literature, you will find that individuals reference others. It can be incredibly useful to look at the articles that are referenced, go to those articles, read them, and look at the other ones that are referenced, and continue. This is primarily how I completed many of my literature reviews. There are so many different formats you can use for introductions so I will not include a suggestion here. However, things that I find useful are when an article sets up the scope of the research within relevant and broad topics, discusses the limitations of the current knowledge, the gaps in the research that need to be filled, why your response variable matters, why your study site matters, and what specifically was your objective. 5. Discussion. Typically, the format follows the order of your results. Is what you found similar or different to what has been discussed in literature? Why do you suspect your results turned out this way? It is our job to untangle the ‘complex story’ of our work into something understandable. If nothing has been done on this topic in the past, use other research to fuel your hypotheses. It is also fine to discuss the limitations in your own research and the need for future work. In my work, we also bring the discussion back to wildlife management — or the bigger picture -- without trying to go beyond the scope of our data/region. Essentially, why does your research matter? 6. Abstract. Try to make your first sentence a clear, pointed start to the manuscript that addresses the topic. You also want, within the first sentence or two, to discuss the problem statement, or gap in the research that you are filling. I then follow up with a bit more introduction and specifically what I did and how I found my answer (what method I used). I then have a brief discussion of the main results I want to convey, and the resulting management implications. ** After all of the blood, sweat, and tears (“Nae pi ttam nunmul”…), you may submit your manuscript and it might get rejected. It sucks, but it happens all the time. My advisor reminded me that reviewers attack ideas, and your ideas are not your entirety as a person. Ideas can be changed. You can take what the reviewers say, correct any flaws, re-submit, or even try submitting to another journal. Your work is important, and the effort you do is not in vain!
8 Comments
12/13/2023 04:16:14 am
Where vitamin B2 supplementation may be necessary. Individuals with restrictive diets, certain medical conditions, or increased nutrient needs may benefit from riboflavin supplements under the guidance of a healthcare professional. 12/13/2023 04:24:45 am
Ensures that your roofing project remains on track, demonstrating a level of expertise that goes beyond routine tasks and contributes to the successful resolution of complex issues. Roofing specialists increasingly incorporate eco friendly practices into their work. 12/13/2023 04:30:44 am
But also for the mind, providing a holistic approach to fitness and athletic development. Elevation training masks are versatile tools suitable for a range of fitness levels and disciplines. 12/13/2023 04:48:28 am
Modern head units often come with energy-efficient designs that consume less power, indirectly contributing to overall fuel savings. This eco-friendly aspect adds a layer of sustainability to your vehicle. 12/13/2023 04:57:35 am
Subtle yet impactful statement that well-executed embroidery brings to the table, making it a timeless choice for those who seek a blend of craftsmanship and chic. In a city known for its strong sense of community. 12/13/2023 05:10:49 am
Keep the momentum flowing contributes significantly to the overall success of the murder mystery experience. Capture the memories of the murder mystery party by incorporating a photo booth or designated photography area. 12/13/2023 05:15:59 am
The setting of a diamond in an engagement ring is an art in itself, with various styles contributing to the overall aesthetic. Whether it's the classic elegance of a prong setting, the vintage charm of a halo. 12/13/2023 05:26:45 am
A nice inclinations implied for the teams’ for all people. The options of the field and for all officials. The changes ensured for the networking for the top of the turns for humans in this field of tax. Leave a Reply. |
ELB MembersBlogs are written by ELB members who want to share their stories about Ontario's biodiversity. Archives
January 2023
Categories
All
|
 RSS Feed