|
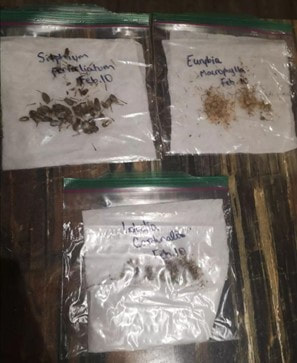
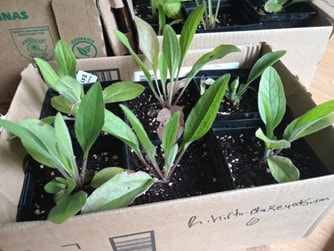
By Shelby Gibson While the weather may not be a good indication, now is the perfect time to start the process of growing many of Ontario’s native plants. Growing native plants is becoming an increasingly important skill as more restoration projects focus on growing native species, and as home gardeners try to support declining pollinator populations. There is an increasing interest in growing native plants, however growing them is different from many other commonly grown garden plants. When growing native plants from seeds germination rates will be partially determined by the method of seed preparation used. Many native plant seeds need to be started in the fall or winter. There are various methods of preparation which are used to break the seeds dormancy and encourage germination. A process called cold stratification is used to mimic outdoor conditions that the plant would experience in its natural environment. This means placing the plants in the fridge for a period of time prior to germination (e.g. 60 days) inside a plastic bag or container. The length of time the plants undergo cold stratification varies between species. Another factor is moisture, meaning some plants need to undergo cold moist stratification. In this case, a source of moisture, such as a damp paper towel, is placed in the container or bag with the seeds during stratification. Yet another type of preparation required by some seeds is scarification, where the outer layer of the seed needs to be physically broken down in order for germination to occur. This can be done with items such as sandpaper. After their preparation period, native plant seeds can be started in a soil mixture in pots or trays. Some require being placed inside the soil while others require simply being sprinkled on top of the soil. The diversity of ways to start native plant seeds represents the great diversity of native plant species the seeds produce. Diversity in methods of preparation and growing means that native plants can be somewhat more complicated to get going. It is important to learn the requirements of each plant prior to beginning in order to ensure that each particular species is prepared correctly. This will lead to increased success with germination and eventually with transplanting the seedlings outdoors. Healthy seedlings are important to the success of planting and restoration projects, and therefore the skill of growing native plant seedlings is important as well. Growing native plants from seeds can be a highly satisfying experience, with the added bonus of providing food for some of Ontario’s native fauna! Helpful Resources: Native Plant Network – Propagation Protocols; https://npn.rngr.net/propagation/protocols Indigiscapes.com – A Native Plant Propagation Guide and Nursery Model; https://indigescapes.com/blog/printed-version. North American Native Plant Society – Indoor Native Seed Stratification; https://nanps.org/96358-2/. And always be sure to follow the ethics of seed collection: North American Native Plant Society - Seed Collecting; https://nanps.org/seed-collecting/. Blooming Boulevards - Seed Collectors Code of Ethics; http://www.bloomingboulevards.org/ethical-standards-forr-naseed-collecting.  About the Author Shelby Gibson (B.Sc., M.E.S.) is a PhD Candidate at York University using a biocultural lens to further understand plant-pollinator interactions. Shelby's research focuses on native medicine plants and other culturally significant plant species. Shelby is interested in solving conservation-related problems using a social-ecological perspective. Follow along on Twitter to keep up with research updates! (@GibsShelby).
3 Comments
by Michael Rogers In my last blog post, I discussed some strategies for budding ecologists to plan their career. I looked at some of the archetypal roles in the field, such as laboratory technician and policy analysts, and some of the defining factors of the ecology sector. If you have not read that blog, I highly recommend you go there first before continuing on with this post! Now that you have a better idea of the types of roles you can have and the different pros and cons associated with each one, you are likely going to want to start to apply to work in the ecology field. For all types of roles, there are a few key websites most employers use for job postings:
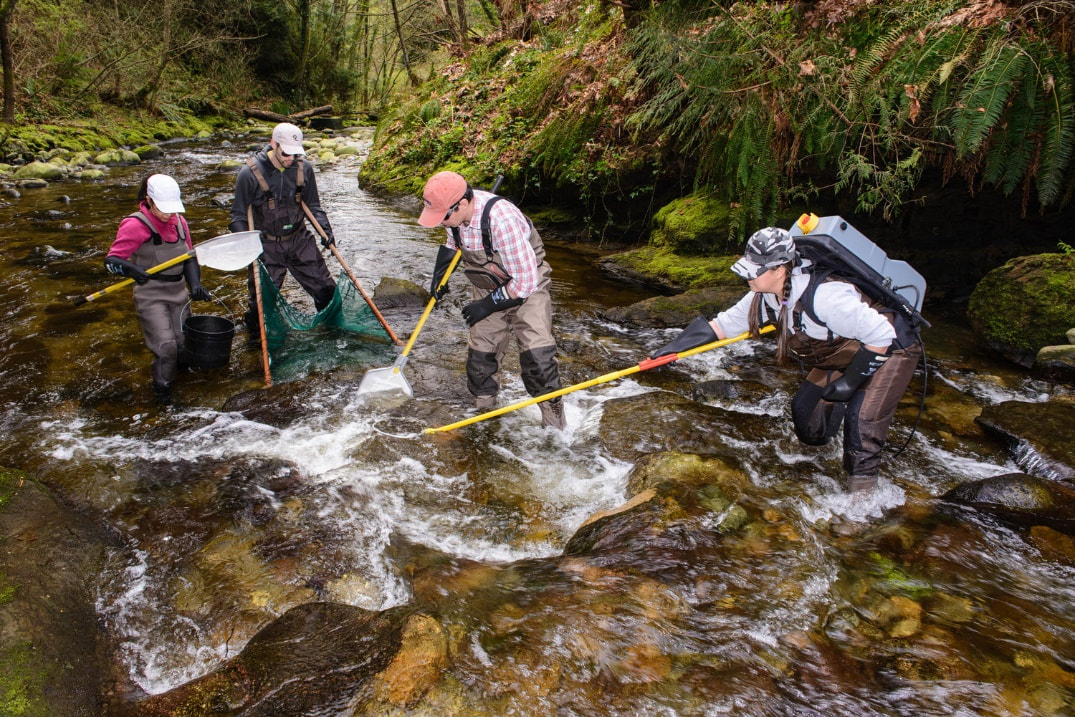
Consider also looking at your University’s/Alma Mater’s and/or professional association’s job search board as a source of many more roles. Like any other sector, your professional connections are one of the strongest sources of support you have in finding job postings and building good reputations with potential employers. If you are just starting out, do not fret about building connections. Do your best to be proactive while in school to build connections with your peers, educators and school-affiliate organizations. Your hard work will pay dividends. Building Skills and Experiences that Employers will Value Professional designations These signal a larger body of knowledge, professional standards, and commitment to ongoing learning. Some employers find these of debatable value, but they cannot hurt your employability chances. Some examples include becoming a certified Ecologist, Environmental Professional, or Ecological Restoration Practitioner. Functional skills These are skills which enable you to fulfill the responsibilities of a role. Many of these skills are translatable between role archetypes. Some popular functional skills include species identification skills, computer/statistics package skills, and writing/editorial skills. It can be valuable to build a portfolio of work from your education, work, and volunteer experiences to share with prospective employers. Volunteer experience The premiere way to break into the ecology field is to build your experiences. The challenge is getting initial experience to start the cycle of growth. Volunteer experiences are valuable to employers and signal a commitment to the field of work. Field work, data organization, and writing contributions through volunteer work can help cultivate some of the above-noted functional skills too. Many local environmental organizations, non-profit organizations (NGOs), and Conservation Authorities are regularly on the search for volunteers. By the way, ELB is always looking for new contributors, too! Certifications of Competencies These certifications signal to employers about your knowledge base and capacities to fulfill role responsibilities. Job postings will note which certifications are requested to fulfill work responsibilities and additional competencies are commonly viewed with positivity. Most are acquired through paid professional workshops. Some examples include: Ecological Land Classification, Ontario Stream Assessment Protocol, Electrofishing, and First Aid Training. This is just the start! Over the next few posts on our blog, we will explore more in depth the above-noted roles and what skills/professional development opportunities you can utilize to be an ideal job candidate. Until next time, you can keep your finger on the pulse of job postings by checking out ELB’s Facebook group, LinkedIn, Twitter, or Instagram. We update each with several job, volunteer, and professional development opportunities each week.
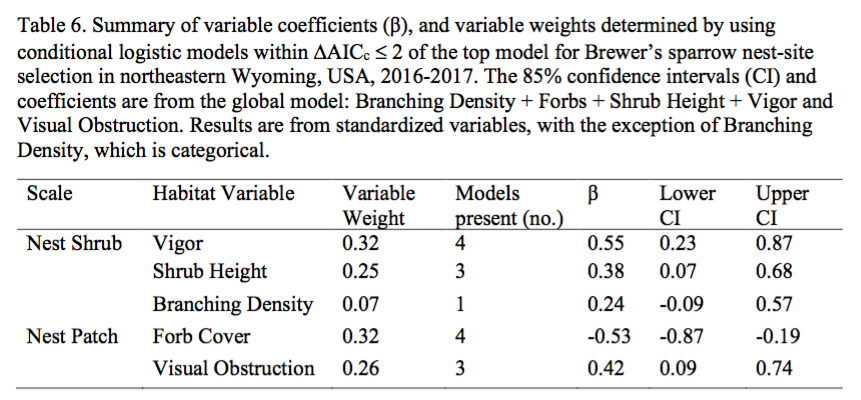
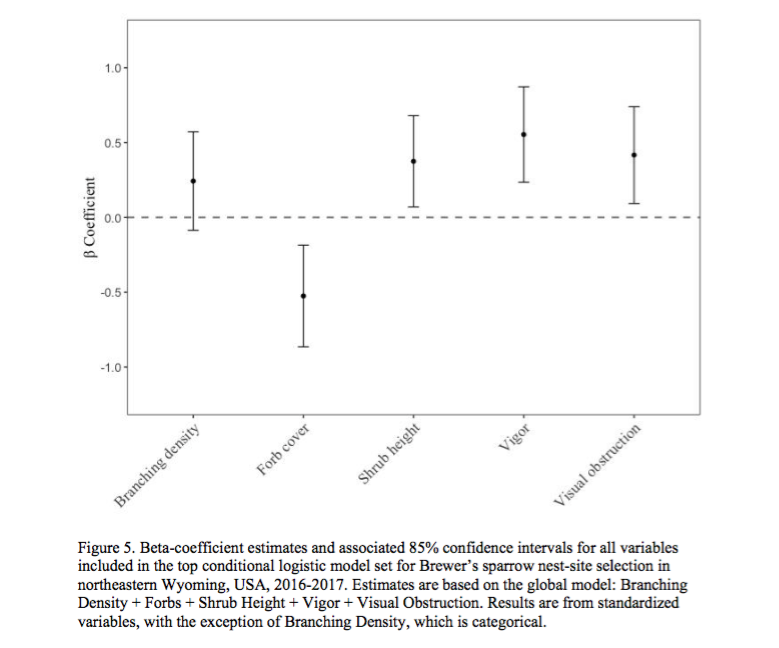
by Natasha Barlow In my last post, I briefly discussed a high-level summary of how I approach analyzing ecological field data. In this post, I will be discussing the method I use to write manuscripts. I should start by saying that when I refer to a ‘manuscript’, I am talking about the written document that you submit to a Journal (e.g., Journal of Wildlife Management) for consideration for publication. My experience is in avian (bird) ecology, conservation, and applied management, which is what I will be discussing in this article. Manuscript You have finished your analysis and it has pumped out some numbers (do not worry, it took me a long time to understand what my numbers meant and many, many, hours of making sure they were ‘correct’). Now what? The format I use to write is: Methods > Figures/Tables > Results > Introduction > Discussion > Abstract 1. Methods. I find this the easiest section to write and complete first. Since you just finished your analysis, it can be useful to write your methods immediately afterwards as the steps you took to get to the results are fresh in your mind. It is also useful to comment your script/code in R/RStudio throughout because you will undoubtedly go back to it in the future and you might have forgotten why you made some decisions that you made. I format my methods in this general way: field methods > justifying collection of variables > modeling approach used (#2 in the previous blog post) > transformations (#5 in the previous blog post; e.g., standardization) > variable selection (#6 and #7 in the previous blog post) > model selection (#8 in the previous blog post). 2. Figures and Tables. Determine how you want your readers to see your data and think hard about the best ways to show them your data in an easy to digest format. For example, would you rather look at the table, or the figure (or neither…) below? We decided to only include the figure in this article upon reviewer request because they essentially show the same thing, but the figure is nicer to look at. However, tables can also be useful. Without explaining the table and figure too much, anything above the horizontal dotted line in the figure you can think of as a bird preferring that variable in areas where it nests, and anything under the line is avoidance (don’t quote me; that’s not a great explanation). Clear as mud? The table is a bit more confusing though, and doesn’t add much to the story - so we removed it. 3. Results. You generally want the flow of your results to be chronological with the flow of your methods. This can be tricky, but I will use this article again as an example. In my methods section, I first mentioned the sampling for nest site selection of one bird species, and then the sampling to compare the preferences in nest site selection of two species. My results would follow a similar order, first showing the results of the one species nest site selection, and then the comparison between species. 4. Introduction. I am not a fan of writing introductions, but I find it useful to use the ‘snowball’ technique. That is, when you are searching through the literature, you will find that individuals reference others. It can be incredibly useful to look at the articles that are referenced, go to those articles, read them, and look at the other ones that are referenced, and continue. This is primarily how I completed many of my literature reviews. There are so many different formats you can use for introductions so I will not include a suggestion here. However, things that I find useful are when an article sets up the scope of the research within relevant and broad topics, discusses the limitations of the current knowledge, the gaps in the research that need to be filled, why your response variable matters, why your study site matters, and what specifically was your objective. 5. Discussion. Typically, the format follows the order of your results. Is what you found similar or different to what has been discussed in literature? Why do you suspect your results turned out this way? It is our job to untangle the ‘complex story’ of our work into something understandable. If nothing has been done on this topic in the past, use other research to fuel your hypotheses. It is also fine to discuss the limitations in your own research and the need for future work. In my work, we also bring the discussion back to wildlife management — or the bigger picture -- without trying to go beyond the scope of our data/region. Essentially, why does your research matter? 6. Abstract. Try to make your first sentence a clear, pointed start to the manuscript that addresses the topic. You also want, within the first sentence or two, to discuss the problem statement, or gap in the research that you are filling. I then follow up with a bit more introduction and specifically what I did and how I found my answer (what method I used). I then have a brief discussion of the main results I want to convey, and the resulting management implications. ** After all of the blood, sweat, and tears (“Nae pi ttam nunmul”…), you may submit your manuscript and it might get rejected. It sucks, but it happens all the time. My advisor reminded me that reviewers attack ideas, and your ideas are not your entirety as a person. Ideas can be changed. You can take what the reviewers say, correct any flaws, re-submit, or even try submitting to another journal. Your work is important, and the effort you do is not in vain!
by Natasha Barlow Starting my Masters at the University of Waterloo was terrifying. Imposter syndrome hits hard, you’re surrounded by people who will question your beliefs (rightly so; intellectual debates are useful), and you’re a fledgling when it comes to understanding the vast world that is ~statistics~. I remember frantically searching online for a ‘how-to’ guide on how to even wrap my brain around starting an analysis on my data. Luckily, I was in Dr. Brad Fedy’s lab, and was blessed to be surrounded by incredibly intelligent people who were willing to help little old me. In part one of this blog series, I am going to give a brief, high-level summary on how I was taught to start analyzing my data. The next post will be dedicated to the format I use for writing manuscripts. This is not to say there aren’t other ways to accomplish the same thing, but this format worked for me, and it’s my hope that it will be useful to you, too. For the purposes of this post I will be using my paper as an example. I will write this blog in a way that doesn’t require you to have access to the article for understanding. However, I am writing this blog post under the assumption that the reader has a basic knowledge of statistics. So…you’ve gone out for a few field seasons (or just one!) and have collected a dataset for your project. Now what? I am a strong believer that the data scientists collect should be published and peer-reviewed to maintain credibility and honesty, and that the knowledge we gain should be shared. Once you decide that you want to analyze your data, and potentially publish your research in a peer-reviewed journal, what is your first step? Your Seven Steps for Success 1. Determine your question. As mentioned in my previous ELB blog post, my advisor, Dr. Fedy, was a strong advocate of the approach, “you can only answer a question as well as you ask it”. It is ideal if you have a good sense of what specific questions you want to answer prior to gathering your data, although these can change with what data you were actually able to collect. 2. Research which analysis is the most appropriate for your question, your study design, your data collection methods, and your data. I really like using Google Scholar, but dedicated websites (e.g., Web of Science) work, too. By looking in the literature, you will likely come across studies that have collected similar data and have answered similar questions. Determine which analysis they performed and look into what is involved. Just because someone published a paper using one specific analysis does not mean it is the most appropriate way to analyze your data. New and improved analyses are being developed all the time, and it is best if you attempt to understand the analyses so your answer is closer to the truth. I eventually came across this McFarlanad, et al., 2017 paper which collected similar data to what I had for my manuscript, and the analysis they used looked like it might work for my study design. I went with it! BONUS TIP: If you email the authors directly or look on github, they may be able to provide you with their code. 3. Organize your data. Our lab uses the software R, and the program RStudio, because they’re free, you have arguably better control over your analysis, and it is used throughout many disciplines. We do not generally manipulate the raw data files themselves, and any transformation of the raw data into a useable format is done within R itself. The organization of your data will likely be dependent on what the analysis requires, and what R package(s) you will be using. You can see some short documents like this one (or longer vignettes) which can assist you in determining what format your data will need to be in. Know that this also takes some trial and error. Save your data organization script as a separate R file and save the transformed data output as a .csv (note: .csv files only save ONE active sheet, so if you change an Excel document to a .csv, it will only save one tab. For R, you will want all your data on one page anyways). 4. View your data. Open a new, separate R file and use it for your analysis. Import your .csv file from step 3, and you’re ready to go. It is generally a good idea to do another quality check on your data, using histograms, boxplots, and any visual tests to ensure that nothing was lost in transition, and there are not any mistakes in your data. This is where you can also test assumptions like normality, using qqplots, and others. 5. Prepare your data. Next, you can prepare your data for analysis. For example, in some cases I standardized my continuous variable data so different variables collected on different scales can be compared (e.g., the percentage of shrubs collected in %, height of grass collected in cm). Perhaps you will need to do log transformations on your data, or other preparations prior to analysis. 6. Check for correlations. It is generally a good idea, if you have a statistical model with multiple variables, that no variables should be correlated within the same model. This can make things very messy, for a variety of reasons that I will not explain here (and would not explain well). 7. Determine which variables to use. This step is generally required if you have a suite of predictor variables and you suspect that some may not actually influence your response variable. In my manuscript, we used univariate model selection and 85% confidence intervals, as well as thinking about biological relevance to the study species. That said, there are a variety of ways to determine which variables to use (e.g., AIC model selection). We started with over 20 habitat variables and narrowed it down to primarily being interested in 7 that seemed to inform our response variable. 8. Run your model. I used conditional logistic regression in my manuscript to determine the probability of nest-site selection of Brewer’s Sparrow based on a suite of variables I collected (the 7 from step #7 above). By viewing the documents on the R packages, you will be better equipped to set up the model formula correctly. Just remember, there are many models that are essentially just extensions of y = mx + b. *** Next, you work on ensuring that you understand the results from your analysis. You can always get answers out of data, but they may not be the right answer. It is our job as scientists to work hard to minimize the risk that we are interpreting something incorrectly. There are also great resources like the free R for Data Science website, or books that can help you navigate this difficult realm of academia! I recognize that this may seem like a huge hurdle to overcome, but I am absolutely not a guru and feel like I should have much more in depth understanding of this process and the analysis than what I currently have. Therefore, you can definitely accomplish this. It can be a challenge, but you can definitely persevere. In the next post, I will briefly discuss my tips for writing manuscripts, so stay tuned!
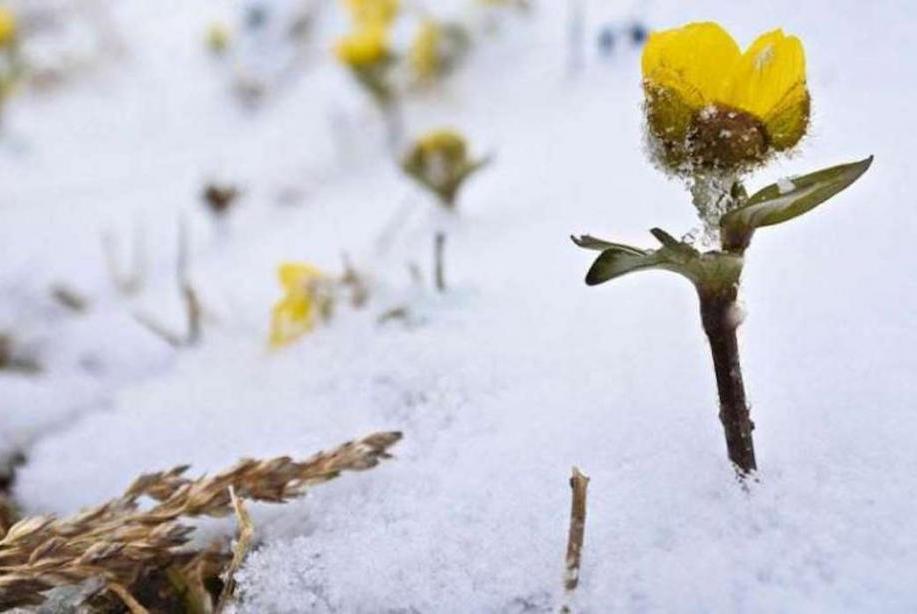
By Dieta Jones-Baumgardt Something doesn’t feel right about looking outside right before Christmas day and seeing green grass. Maybe it is from hearing the countless Christmas songs that sing of a white holiday or watching movies that show a beautiful white wonderland. Snow and ice are dominant features of our Canadian landscape, synonymous with our winters. Both play an important role in the climate system. Over the past few years, more and more studies are focusing on the impacts of reduced snow cover. On the large scale, the presence of snow and ice on the earth’s surface help to moderate climate through the reflection of sunlight back into the atmosphere. On the smaller scale, without the snow cover, species will decrease and potentially become extinct. For example, Luoto, a professor in natural geography from the University of Helsinki, predicts that many iconic species of the Arctic areas, such as the glacier buttercup, will decrease significantly due to the changing snow situation. Many of the species in the northern mountains only thrive in areas with snowdrifts. Luoto conducted a study in the Arctic, where snow cover has dramatically changed, and found that decreasing drifts will increase the risk for extinction for plants like the snow buttercup, mountain sorrel, and mossplant; some of the most iconic species of the region.
Overall, changes in snow and ice affect the behaviour of the climate system and have direct impacts on water resources, terrestrial and marine ecosystems, wildlife, economic activities and human well-being. Although we can predict temperatures fairly accurately, it is more difficult to predict rainfall and with snow, it is even more uncertain. To predict the effect of warming on snow cover, it is really difficult. Studies like this from Luoto are helpful to understand how reduced snow cover will impact biodiversity. Using the information from the Arctic is a helpful starting point to understand how to better mitigate biodiversity losses in other areas. Hopefully with new research and more noticeable climate changes like green grass on Christmas, solutions can be made to protect our biodiversity. Reference: Pekka Niittynen, Risto K. Heikkinen, Miska Luoto: Snow cover is a neglected driver of Arctic biodiversity loss, Nature Climate Change letters. https://doi.org/10.1038/s41558-018-0311-x
by Michael Rogers Are you looking to explore a career in ecology? A career in ecology can take you many places but where should you start? Emerging Leaders for Biodiversity (ELB) is a fine place that many of us have relied on to start our exploration. ELB’s blog is full of a number of insights and stories from other early career ecologists to help support those who are trying to get their footing. This post is the first in a series on our blog exploring different ecology roles, how to look for these roles, and what opportunities to target in order to make yourself more competitive for these roles. Before we get ahead of ourselves, it’s important to understand some background context about the sector in order to align our expectations. Working in Ecology is Full of Ups and Downs One of the great joys about ecological work is that there are so many ways to be involved. Each requires a distinct mix of skills, knowledge, and responsibilities. Finding the right role requires self-exploration and perseverance. A love for the outdoors is a key contributor to one's perseverance through the volatility that is being an early career ecologist. Many positions are ephemeral. Even the best of jobs are not always available and those well-suited contracts are likely to end as funding dries up. The truth of the matter is, the ecology sector is highly competitive, and funding to support wages is scarce. A key funder, The Canada Summer Jobs program, works with employers to hire young professionals (under 30 years old) capped by 2, 4 and/or 6 month contract terms. Most young ecologists will find themselves working these short-term contracts as funding for roles becomes available and as seasonal needs change. It commonly takes several years of an ecologist’s career jumping between contracts before landing in a long-term career-defining role. To some, this is a hardship that must be acknowledged before diving headfirst into an ecology-based career. To others, this is an opportunity to explore yourself, obtain a variety of experiences, and build valuable professional connections. What are the Archetypical Roles? Field Technician: This the most commonly sought after ecologist role for entry-level seasonal work. Individuals in these roles must be comfortable working outdoors. These roles tend to focus on specialization in subject-specific matter depending on the project manager’s needs (e.g., fisheries, flora, fauna, habitat-type, etc.). Field technicians have a depth of practical ecological knowledge including species identification, surveying, and data tracking. Laboratory Technician: While most lab technicians do get out in the field, their home is in the lab processing samples and verifying work of other ecologists. Lab technicians usually have more specialized expertise focusing on one domain of interest. Data Analyst: These roles support ongoing project reporting and are predominantly found during the “off-season” (November-March). Data analysts can function well independently and have good problem-solving and computer skills. Policy Analyst: A supporting role of organizational advocacy, constituent engagement, and technical reporting. Roles can require a variety of backgrounds and specialties, but all require focusing on political interactions and outcomes. Policy analysts must be politically well-informed and thorough with their work. Communications: A role that is growing in demand. Focused on expanding ecological outreach programming, writing, and events organization, those in communications benefit from creative thinking to share ecological knowledge with constituents using a variety of mediums. Defining Factors of the Ecology Sector Wearing Multiple Hats Employers often allocate a contract to split time between projects. Take note of postings that ask for a mix of responsibilities. Having a multi-faceted background can be valuable to employers seeking to split your time between managers. It is equally important to balance your skillset portfolio to specialize, too (e.g., identification skills). The Reason for the Seasons Early career ecology contract availability follows the seasons, mirroring ecology itself. Year-round contracts are much rarer and favour those with a few years of experience under their belt. Postings are made year-round, but you will find more roles focused to the lab, data analysis, policy, and communications after the field season. Field-based roles are most commonly hired between February and April for summer contract-based work May-August. You might notice that data analyst and lab technician postings become more popular during the late summer through the winter - someone has to process all the data that the field technicians collected! Communications roles are often posted when organizations are ramping up their outreach communications preparation during the spring and early summer. Expect a rise in communications postings during the winter to start work in the spring and early summer.
This is just the start! Stay tuned in the coming months as various blog writers explore "Where are all of the jobs?" and "How to Build Skills and Experiences that Employers will Value". We will be doing an analysis of real job postings, the qualifications that are required for specific roles, and how you can actively attain these qualifications before your desired job postings open. And as always, if you have specific questions or job postings you would like us to analyze, email us at [email protected]!
by Christian Wormwell Healthy wetlands in Ontario are home to dozens of species of birds and amphibians that many Ontarians may never get a chance to see. Marsh birds like Yellow Rails are notoriously difficult to spot – the Cornell Lab of Ornithology says that “if you're looking at a rail in the open, it's almost certainly not a Yellow Rail.” Even the relatively bolder species of rail like the Virginia Rail or Sora spend most of their time hidden in the reeds, outside of the view of the prying eyes of predators or nature enthusiasts. Wetlands are extremely vulnerable and have been declining in size and quality around the world due to human influence. This makes monitoring these secretive wetland species even more critical. To do this, we needed to find a way to monitor these wetland species across our vast provinces in a single season each year. To address this, Birds Canada, a non-profit organization dedicated to the conservation of birds and their habitats, created the Marsh Monitoring Program. This program enlists volunteers to survey wetlands around the Great Lakes, Quebec, and the Maritimes for the purposes of tracking populations of wetland birds. It has since expanded to include frogs and toads in some locations.
I volunteered to survey for the first time in 2021. On my very first survey trip at the first point on my route, I had a wonderful encounter with a focal species. When my speaker belted out the pig-like grunting of a Virginia Rail, the same sound emanated from the marsh. A little grayish bird came tumbling over the reeds – a Virginia Rail, presumably looking to find the other rail it heard from the speaker. It was my first time seeing one in person and I was taken aback by how small it was, as the photographs I had seen online gave the impression of a heavy, plump, nearly chicken-sized bird. It certainly appeared a bit portly and had a chicken-like gait, but could have easily fit in my hand. To my surprise, the bird continued right out of the reeds and onto the mud in full view no more than six feet in front of me. It looked around, did a sort of twirl (showing that it actually was not much wider than the reeds when faced head-on), made that unusual pig-like call again, and scampered back into the cover of the marsh. All this happened within a matter of seconds. Of course, the data collection is the focus of the surveys, but the opportunity to spot otherwise-secretive marsh birds keeps it from feeling like work at all.
by Christian Wormwell
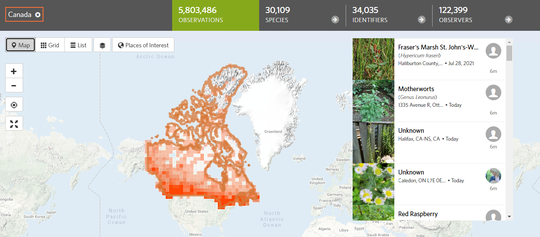
iNaturalist is a community science website with over 300,000 active users worldwide. It functions like a social media site for nature lovers, where people share their photos or audio of living organisms from any domain or kingdom of life through submissions called “observations”. Users work together to help each other identify the species depicted. As well, artificial intelligence technology can help determine which organisms may be in the photo. iNaturalist observations have real implications for science and their data is used worldwide. An unofficial list cultivated by users on the site’s forum keeps track of published scientific papers that incorporate iNaturalist data; the list has 42 entries from 2020 alone, in publication topics ranging from changes in morphology in leopard frogs in California, to a leaf beetle being found in Bulgaria for the first time. Many of the papers listed are about range expansions for species, which is an area iNaturalist data excels in. It was an iNaturalist user who reported the first instance of the destructive zigzag elm sawfly in Canada, and the Government of Canada’s official website now has a fact sheet for the pest that includes a link to iNaturalist. iNaturalist is certainly a great place for community scientists. For example, Ontario's Natural History Information Centre (NHIC) runs an iNaturalist project that keeps track of sightings of threatened species across the province, and the Ontario’s Government website contains articles encouraging people to submit sightings of threatened species. Checking my iNaturalist statistics, I can see that I have recorded nearly 40 species tracked by the NHIC that are considered threatened or otherwise vulnerable in Ontario; some were even in my suburban backyard. I would not have known of their identity or conservation status was it not for iNaturalist! All one needs to do to get started is create a free iNaturalist account and start uploading photos or audio. The mobile App allows users to photograph species and submit observations right from the field. No expertise is needed – if all one can determine is ‘this is a bird’, the global community including experts in any domain of life, can help identify the species.
Every time I go for a hike, my phone is in my hand – some might like to distance themselves from technology on their hikes, but iNaturalist has become a fundamental part of my trips due to the fun and knowledge I have gained out of it since that fateful day in the Glen. Contributing to science, whether great or slight, makes using iNaturalist a powerful, rewarding incentive and experience.
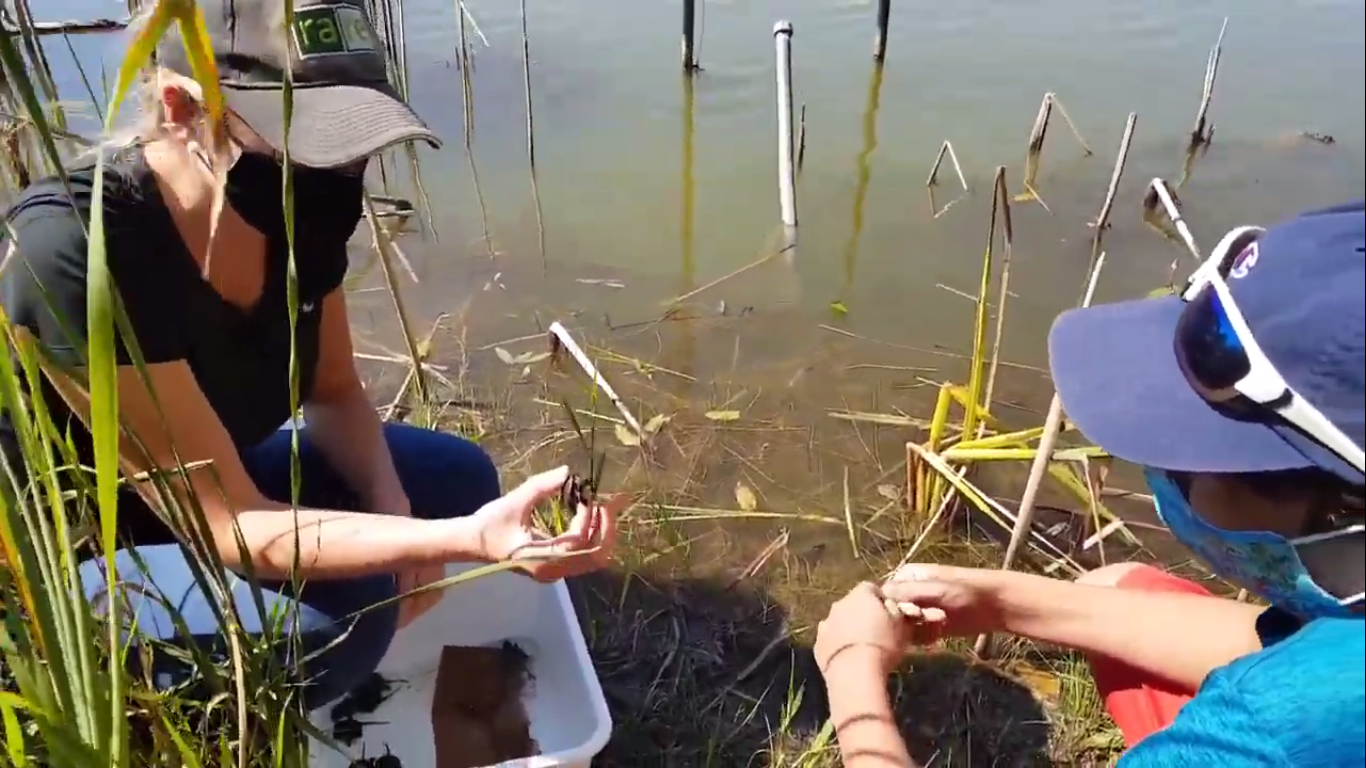
by Michael Rogers The COVID-19 pandemic is flavoured with the sour taste of lost opportunities. Field work programs have been set back, employment opportunities have become scarce and outreach campaigns have moved to remote formats. To address these challenges, virtual technology has proven a valuable tool to enhance connections, accessibility, and social progress in the biodiversity conservation industry. Virtual technology can be used in creative and engaging ways. The SER2021 World Conference will make good use of the virtual format. It offers virtual field trips with new-age technologies like drone footage, 360° viewing towers, and time-lapses of restoration sites from around the world. The Society of Ecological Restoration (SER) offers opportunities to build your professional connections both in attendance at SER 2021 and as a volunteer to help organize the conference. SER is one of many professional associations that offer webinars to maintain your professional standing. SER even granted me permission to fulfill my knowledge requirements with their virtual learning content! Virtual learning is a powerful tool to connect professionals with emerging ideas, other professionals, and with members of the public. Never has it been easier to bring the outdoors inside. Virtual technology provides outreach programs a cost-effective and logistically practical solution to address accessibility challenges. Live-streams from the field can offer aspiring naturalists opportunities to learn through job shadowing. As an example, the rare Charitable Research Reserve offered regular live-stream updates from their field technicians regarding their snapping turtle rearing program. Virtual presentations also offer free education to those who lack the financial means to travel. Environmental education that is recorded and translated from across the globe is in growing demand to inspire appreciation of the natural world. Virtual technology is truly an awe-inspiring victory for accessibility. Photo: A screenshot from the rare Charitable Research Reserve's September 1, 2020 YouTube video, "rare Turtle Release". Increasing accessibility has also led to embracing inclusivity of diverse perspectives. For example, land acknowledgements and prayers at virtual events increase visibility of Indigenous practices and knowledge. Virtual presentations transcribed by artificial intelligence are also becoming the norm to help engage English as a second language (ESL) learners. Demand for virtual technology access has strengthened proposals for affordable and reliable internet to remote areas of Canada. Virtual technology is becoming a part of the toolkit to address challenges of traditional forms of environmental communication. COVID-19 is a test of human ingenuity in many respects. It is empowering to reflect on the successes we have had despite the pandemic. Embracing virtual technology has helped build robust professional networks, address accessibility needs, and advance social progress of environmental solutions knowledge.
by Heather Kerrison Conservation was the flint that sparked my passion. I have always loved animals and nature, which drove me to start a Bachelor of Science majoring in Zoology. I love science and its ability to seek out answers and solutions. However, something that began to strike me as I continued on my journey as a young scientist and a young conservationist was the sense that science could provide us so many answers, yet here the world was, still asking the same questions. Then a phrase started to pop up: “the gap”. This referred to the gap between scientific knowledge and findings and the translation of that material to accessible information that then informs the public, informs policy and becomes a more “common” knowledge. Something else I have also always been overtly passionate about is written word, sharing and shared experiences. This is where conservation becomes action. I think that all conservationists should strive to become educators, to translate, to spread word and cultivate care. After becoming a species and environmental educator for the first time I realized how important it is to connect what science knows to what other people do not. To use the power of research to create a feeling, a driving force in our human nature. Social media can be an amazing tool to spread educational messages, invoke emotional response and gain traction. All educators are not conservationists, but I truly believe that all conservationists should strive to become educators, so that more people can be in the know. When we know better, we can be better.
|
ELB MembersBlogs are written by ELB members who want to share their stories about Ontario's biodiversity. Archives
January 2023
Categories
All
|






 RSS Feed